You probably know someone with anxiety or depression; a friend, a loved one, a colleague, maybe even yourself. And no wonder, the world often seems all too enthusiastic to doll out stuff to get anxious or depressed about: ever scarier and impactful climate change, a loneliness epidemic, political upheaval, economic instability, the unknowns of AI, maybe some old-fashioned negative social comparison on social media, or maybe a smattering of all of the above. The world is scary and hard and, ready or not, our mental health takes on the weight.
Back during the Covid-19 Pandemic, health was obviously on everyone’s mind. But beyond the virus, health and social scientists got increasingly worried about mental health as well. This historically underfunded and frustratingly complex field has been rising out of social stigma and public obscurity for years but rocketed to the forefront as we all started to lock our doors. Health and social researchers knew anxiety and depression would almost assuredly become even bigger issues with the pandemic lockdowns. Meanwhile, the general public was about to encounter mental health challenges to a degree and frequency unprecedented in human history…so what better time to run a survey?
For a little over 3 years, the CDC ran a pulse survey collecting data on depression and anxiety symptoms. As a result, we have data for nearly every month of how common anxiety and depression symptoms are for different people. Crucially, we get to see if there are any trends across time and how consistent they are. For example, do women have higher anxiety than men, or do they sometimes fluctuate higher or lower? We’ve seen average rates of anxiety and depression before–think big surveys collected once every few years– but this data gives us a new look at near real-time variations and trends over time for loads of different people.
Depression & Anxiety: What are they?
Depression and anxiety are often mentioned in the same breath and, true to that, they often co-occur. That may sound rather obvious (“bad emotional thing” does tend to go with other “bad emotional thing”) but it’s important to note because they are complex, distinct, and often get confused with one another.
Depression
Depression is a disorder characterized by psychological changes such as negative mood, loss of interest in most things (especially things one used to find interesting/enjoyable; clinically, you’ll see the term anhedonia for this), low self-esteem and motivation, and sluggish thoughts; and physical changes such as tiredness/lethargy, sleep disturbances, agitation, and weight gain/loss. There is no single, objective test for depression, instead we rely on how many and how often these aforementioned symptoms turn up.
For how much depression negatively affects people’s lives–reducing life expectancy (some estimate by up to 10 years) via suicide or contributing health issues; impairing work, social life, and education; generating economic and healthcare burdens– the WHO has estimated depression will be the number 1 burden of disease worldwide by 2030 (and it might be already).
Why depression is what it is, and why it’s getting worse, is literally a trillion dollar question. Some have called depression a “disorder of modernity”, citing a mismatch between how humans evolved and the daily lives we lead today (put bluntly, humans are “overfed, malnourished, sedentary, sunlight-deficient, sleep-deprived, and socially-isolated“). But that is just one of many best guesses; there are a number of other hypotheses and complex factors (biological, genetic, environmental, psychological, social) in play. In truth, we don’t fully understand what exactly causes depression and probably won’t for some time. What is clear though is that depression is a major problem now and into the future.

Depression estimates vary place to place and by different measurement standards. However, it appears depression rates have been rising sharply worldwide, rising about 50% since the 1990s, and especially among women and young people. Worldwide estimates range from anywhere of 5% to 13% of adults, though those numbers go up much higher when looking at more developed countries. In the US, depression affects about 10-20% of the population.
- According to the CDC, about 20% of all Americans have some depressive symptoms, with about 8% at the moderate to severe level.
- A Gallup Poll (100,000 people across the USA) shows about 18% of adults self-reported they were given a depression diagnoses in 2023.
- The National Survey on Drug Use and Health Survey (nearly 70,000 interviews!) has consistently suggested about just shy of 10% of adults experienced at least one major depressive episode (about 8% in 2021, about 9% 2020).
Anxiety
From the get-go, it’s important to note anxiety is perfectly normal and adaptive (as an emotion psychologist, I can recommend the film Inside Out 2 for this point). Anxiety is a state tied to preparation for potential future negative events (in contrast to fear, which is a response to attend to immediate negative events). In evolutionary terms, anxiety is our internal warning bell–it rallies our attention, helping us identify and then prepare for threats.
Generally, anxiety is characterized by symptoms of restlessness (“feeling on edge”), difficulty concentrating, muscle tension, and sleep disruption. These symptoms themselves are not necessarily concerning (remember anxiety is functional and normal), so what makes an anxiety disorder is when those anxious worries and symptoms occur 1) frequently over a long period of time (e.g. most days across 6+ months) 2) cannot be controlled and 3) cause significant distress or impair other functioning in life (e.g. relationships, work, education etc.).
In short, an anxiety disorder is when the internal alarm bell goes off all the time for things that aren’t truly alarm-worthy and you can’t make it stop ringing.
Anxiety disorder rates are hard to pin down, depending on how you measure it and where you look. Some studies suggest ranges as wide as 1% to 30% or 4% to 25% of the population. However, most research agrees anxiety disorders are very common (perhaps upwards of 1 in 3 across the lifespan) and are likely the most frequent form of mental disease worldwide.
There’s been particular attention for anxiety in young people, likely spurred by loneliness and social media (in the US and worldwide), nearly doubling from 2008 to 2018 to affect 15% of 18-25 year olds in the US. Also, women are particularly vulnerable to anxiety disorders relative to men.
Overall, anxiety seems to negatively affect anywhere from 20% – 30% of the US population
- In a nationally representative sample, about 40% of US adults report having at least mild anxiety symptoms.
- Another national study of mass interviews (nearly 30,000!) suggests about 20% of adults have at least mild anxiety symptoms.
- Nearly 20% of US adults have an anxiety disorder at any given time, while about 30% of people have an anxiety disorder at some point in their lives.

If you need a shortcut, here’s a decent heuristic to distinguish the depression and anxiety:
At the risk of oversimplification, the emphasis in depression on losses and disengagement from unachievable goals provides evidence depression is associated with a past orientation. In contrast, anxiety is more associated with a future orientation (Eysenck & Fajkowska, 2018).
One shared consistency for both anxiety and depression relevant for us here–adolescents, young adults (age 18-29), females, and people of color tend to get hit harder than anyone else (e.g., here, or here, or here or here). Other research studying mental health early in COVID-19 pandemic bears those trends out, so we may see something similar in the survey results ahead.
Research
Data Details
All data and information comes from the CDC Household Pulse Survey.
- Sample: The CDC sampled around 60,000 individuals across the USA roughly each month from July 2021 to September 2024
- Measuring Depression and Anxiety:
- Respondents answered how often they experienced certain depressive and anxious symptoms over the past 2 weeks (ranging from 0 = not at all, 1 = several days, 2 = more than half days, and 3 = nearly every day). They answered two questions, thus someone’s total score could range from 0 to 6–if they scored at least 3 or above, they were counted as depressed or anxious here.
National
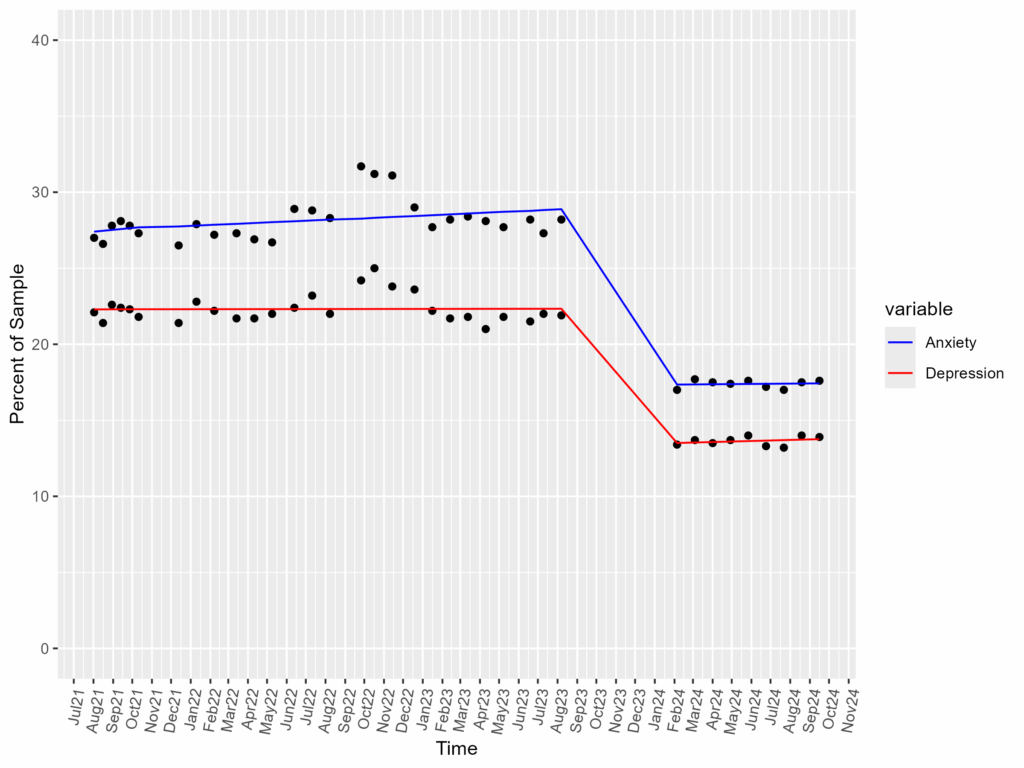
First up, let’s talk big picture. Here are their depression and anxiety data across the whole US over the period.
A few things to note from here:
- Data Gap and Score Cliff
- See that gap of data points in the center-right–those big diagonal lines in empty space? The CDC stopped data collection from Aug/Sep 2023 until the start of the new year, Jan 2024. When they started collecting again, depression and anxiety scores were notably lower than before. Without further info in their documentation, we can speculate at least two plausible explanations:
- a) Methodology Change: I.e., depression and anxiety scores dropped due to a change in research process (e.g. new sampling strategy, sending out surveys differently, scoring responses differently, using new metrics etc.).
- Given how consistent the pre- and post- data appear, and how large of a drop, this seems a plausible explanation (and as will be seen in subsequent demographic groups, this drop affected everyone about the same)
- b) Mental Health Changes: I.e., depression and anxiety scores dropped due to something in that time period (e.g., ending of pandemic procedures, increased tolerance to stressors etc.). That would mean people actually are much less depressed or anxious, 2024 is indeed simply a different ‘time to be alive’ than summer 2023 and before.
- a) Methodology Change: I.e., depression and anxiety scores dropped due to a change in research process (e.g. new sampling strategy, sending out surveys differently, scoring responses differently, using new metrics etc.).
- See that gap of data points in the center-right–those big diagonal lines in empty space? The CDC stopped data collection from Aug/Sep 2023 until the start of the new year, Jan 2024. When they started collecting again, depression and anxiety scores were notably lower than before. Without further info in their documentation, we can speculate at least two plausible explanations:
- Anxiety More Common than Depression
- Across every time point, anxiety holds about 5 percentage points higher than depression.
- Flat, Straight Lines
- The best fit lines for these data are pretty flat (see Technical Details for more)
- Depression is flat across time in both periods, holding first at around 22% from 2021 to 2023, then at 11% from 2024
- Anxiety is also pretty flat across time in both periods, holding first around 25% from 2021 to 2023, then at 18% from 2024
- The best fit lines for these data are pretty flat (see Technical Details for more)
A) Separating statistical models: A simple, singular linear model won’t describe this data well. Imagine we just tried fitting a single model to this data aggregated all together, it’d appear something like this on the right –>
Statistically, this collapsed model on the right suggests a clear, consistent, and rather large decrease in depression over the past 4ish years. However, just looking at the raw data points, we can tell that’s not necessarily the case: it’s more like there was a mostly stable period–a gap–then another lower but mostly stable period.
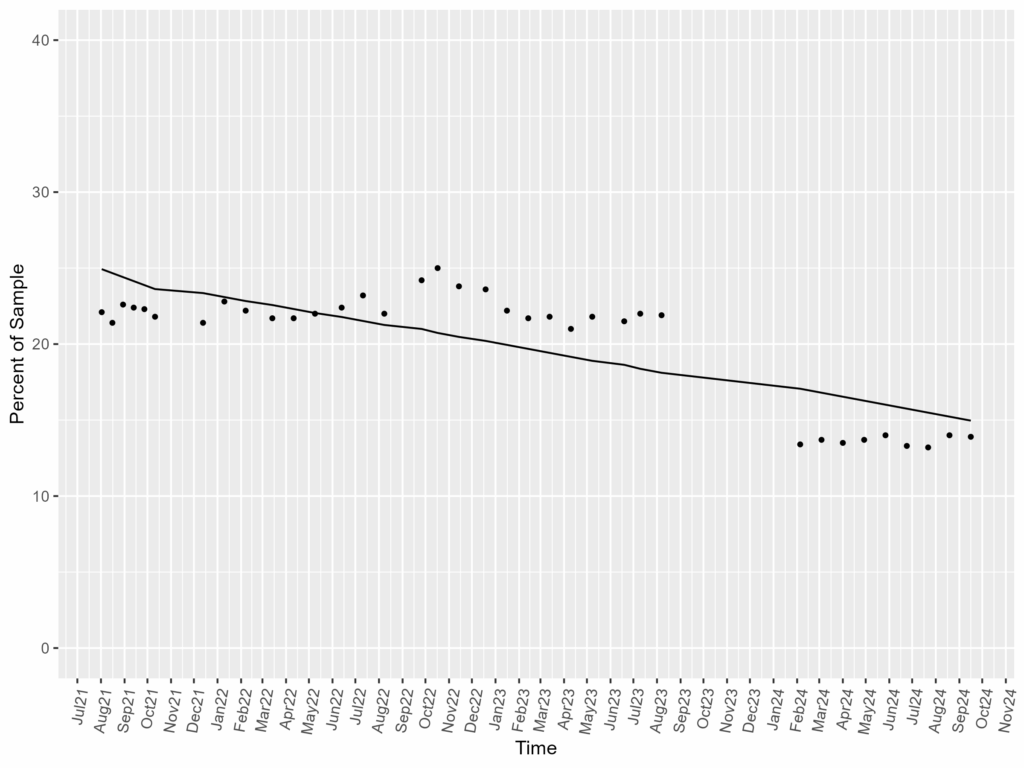
Therefore, I spliced the data into two models to reflect each period in this and all future analyses. I.e., I have separate models to reflect from July 2021- September 2023 (Time Block 1) and January 2024 – October 2024 (Time Block 2). A consequence of this is that we will be able to see different trends across each period–e.g. perhaps there’s an upward slope from 2021-2023, but a downward slope in 2024 (or vice versa).
B) Model Comparisons in Technical Details Subsections
You’ll see Technical Detail subsections which include some comparisons between models with and without interaction terms. This is extra, very very optional information, but If you want to know a bit more, read on.
Each model explains a certain amount of variance in the data for a given number of predictors. Essentially, I want to predict Y based on X1 and X2, to however many predictor Xs I have. The more predictors I throw in, the more complicated the model gets but the model will naturally get better at predicting Y. The question therefore is one of parsimony–if I add a predictor, will the model get better enough to warrant making it that much more complex? We can evaluate this in terms of chi-square difference tests. When we fit a model, under the hood we’re trying to find a model equation that maximizes the likelihood we would end up with the data we found. Each model therefore has a log-likelihood (we use a natural logarithmic transformation on it for legitimate reasons…and also it’s fun) attached to it. These log-likelihood statistics happen to follow a chi-square distribution (Χ²; another fancy stats distribution). So we can compare the log-likelihood of one model to another–how much more likely, how much “better”, is one model at fitting the data– and use the chi-square distribution to evaluate whether that difference in loglikelihood is worth the extra complexity. Hence why you’ll see some ΔΧ², the difference in chi-square, statistics reported in these sections.
The primary question of an interaction test here is to check if any of the given predictors are changing over time. Without an interaction, we’re essentially saying all the relationships, all the trend lines, would basically be parallel to each other. One may be higher than another, but each line does not (and will not) cross the other no matter where you look on the graph. If I add an interaction, I introduce the possibility that some trend lines might cross each other. Essentially, interaction terms introduce the possibility that some predictors may get stronger or weaker over time.
C) Statistical Reporting
Sometimes I’ll talk about coefficients and 95% confidence intervals (CI) in brackets [lower bound, upper bound] from the statistical models. I report effects (also known as beta weights, e.g. b = some number #) with CIs rather than p-values for more descriptive statistical reporting (e.g. b = .10 [.03, .14]). Note that CIs reflect “statistical significance” like p values but with more detail and consideration of effect size than a baseline, rather arbitrary comparison of p to 0.05. If a CI spans 0, that roughly translates to “given the variance we see here in our data, the true value of this effect could be positive OR negative.” Given positive estimates should all be positive, and negative effects should all be negative, this is solid grounds to conclude said value, whatever it truly is, is either zero or close to it. Another way to think of it; a CI spanning zero says an effect is “unconvincingly far away from zero”. If a CI is outside 0, that roughly translates to “the true value of this effect is probably non-zero…but it’s up to you if you think that non-zero number is meaningful.”
Age
Depression
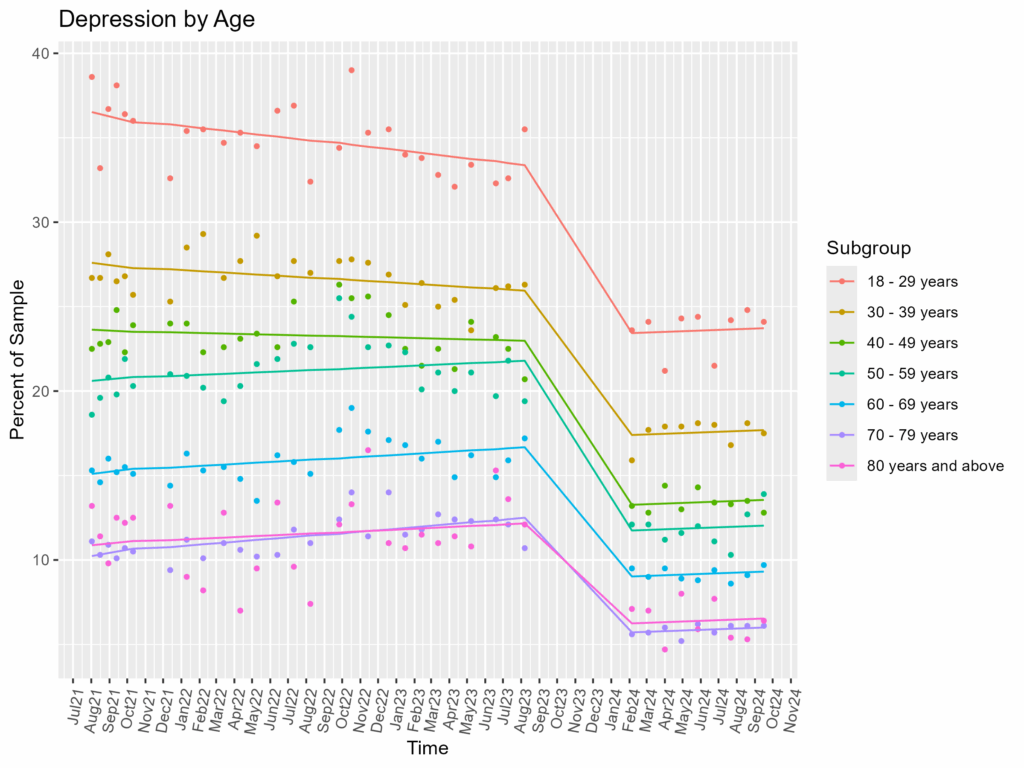
- Younger = More Depressed
- From 2021 to 2023, 18-29 year olds were a whopping 20 percentage points above average, though they slowly got less depressed over time until hitting a floor in 2024, holding at around 11 percentage points above average.
- 30-39 year olds fared only a tad better; from 2021 to 2023 they were 9 percentage points above average, getting slowly less depressed until also hitting a floor in 2024, holding at around 5 percentage points above average.
- Older folks (ages 70-79, 80+), were the opposite: from 2021 to 2023, they were 13 percentage points below average but slowly increasing. They then hit that data cliff (see earlier) and held at around 7 percentage points below average.
- Overall, we see clear stratification from younger (highest depression) to older (lowest depression)
- Converging Lines to Holding
- From 2021 to 2023, interaction slopes suggested age groups were not only changing over time (i.e. each age group line is not all parallel to each other) but they were also converging (albeit slowly). However, from 2024, the age groups all found their trench and stayed there. (see Technical Details)
Anxiety
Anxiety has very similar patterns with depression when split by age.
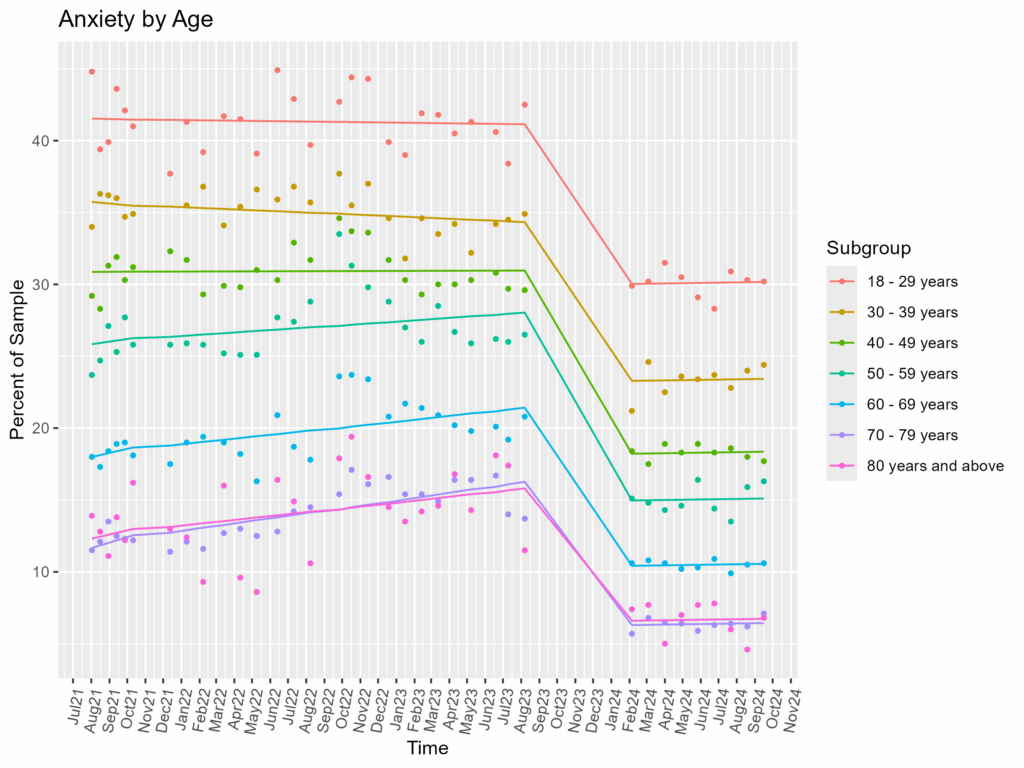
- Younger = More Anxious
- No surprise perhaps, but 18-29 year olds have high anxiety, about 19 percentage points higher than average from 2021-2023. Unlike with depression, they hold there the whole period before dropping to another hold at around 14 points above average in 2024
- Again, 30-39 year olds are next up at about 14 percentage points above average from 2021-2023
- 70-79 and 80+ once again practically combine together, acting the same throughout. They were 17 percentage points below average from 2021-2023 before holding out at 9 points below average from 2024
- Converging Lines to Holding (Again)
- Again we see some interaction effects from 2021 to 2023, suggesting different age groups saw their anxiety change differently across time, and that they (very slowly) looked to converge. But once again, they leveled out in 2024, returning to consistent differences (parallel lines)
Sex
Depression
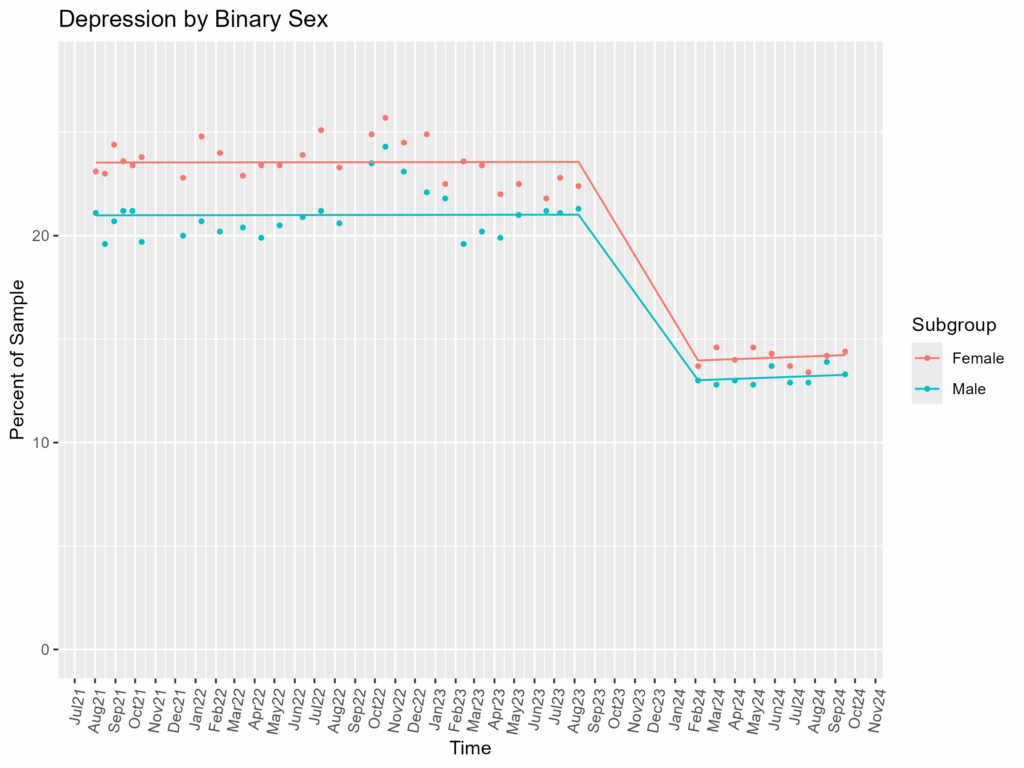
- Mostly the Same, Though More Female Depression (~14% in 2024)
- Female respondents were only a bit more depressed than male respondents, about 2.5% percentage points from 2021 to 2023, and a mere 1 point from 2024. (see Technical Details for more).
Anxiety
However, we start to see sex differences here with anxiety.
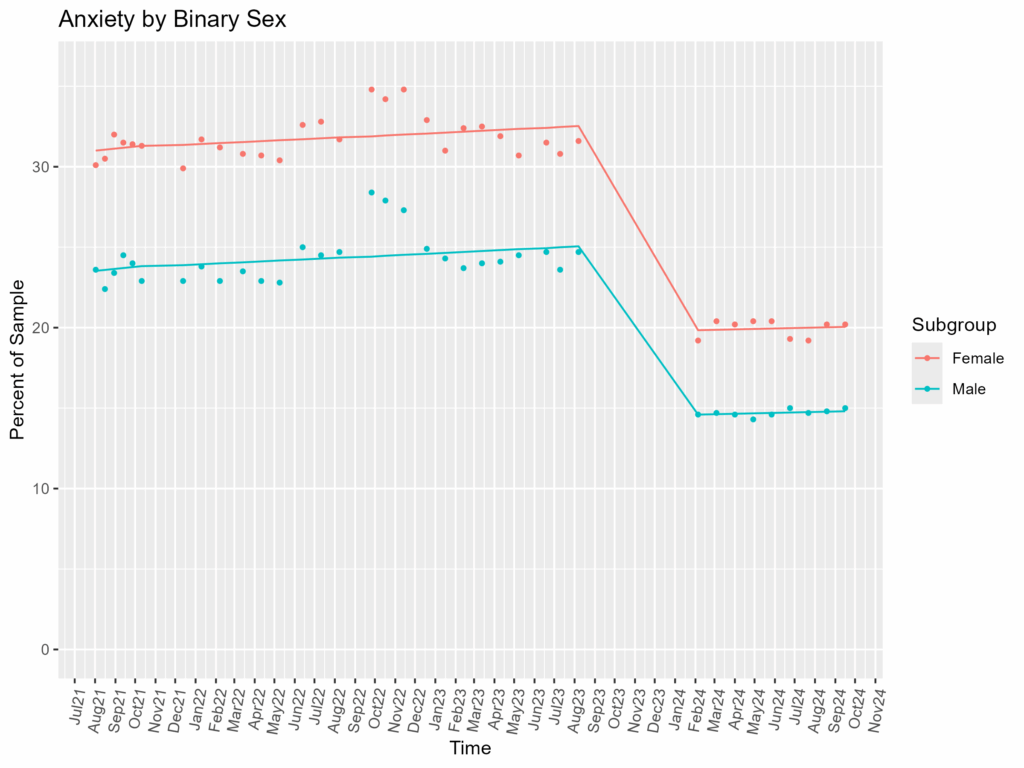
- Female Respondents are More Anxious (~1/5 women in 2024)
- Female respondents tended to be about 7 percentage points more anxious than male respondents from 2021-2023, then dropped to just 5 percentage points from 2024.
- Interestingly, while the difference is bigger from 2021-2023, the female/male scores are more variable. While the average difference is smaller in 2024, it’s much more precise (see Technical Details for more).
- Female respondents tended to be about 7 percentage points more anxious than male respondents from 2021-2023, then dropped to just 5 percentage points from 2024.
Gender
These CDC data rely on a 3-part gender distinction: women, men, and transgender. While better than the outdated and simplistic binary classification, it’s still limiting. As such, we won’t be seeing other gender categories (e.g., Nonbinary, Bigender/Genderfluid, Agender. See here if you want to learn more about gender and gender measures).
This data also has some abnormalities, missing a few data points for transgender respondents (hence why some gaps in trend lines). It is unclear from the CDC documentation why that may be the case (e.g., potentially too few or no transgender respondents that survey?), but we can make do all the same.
Depression
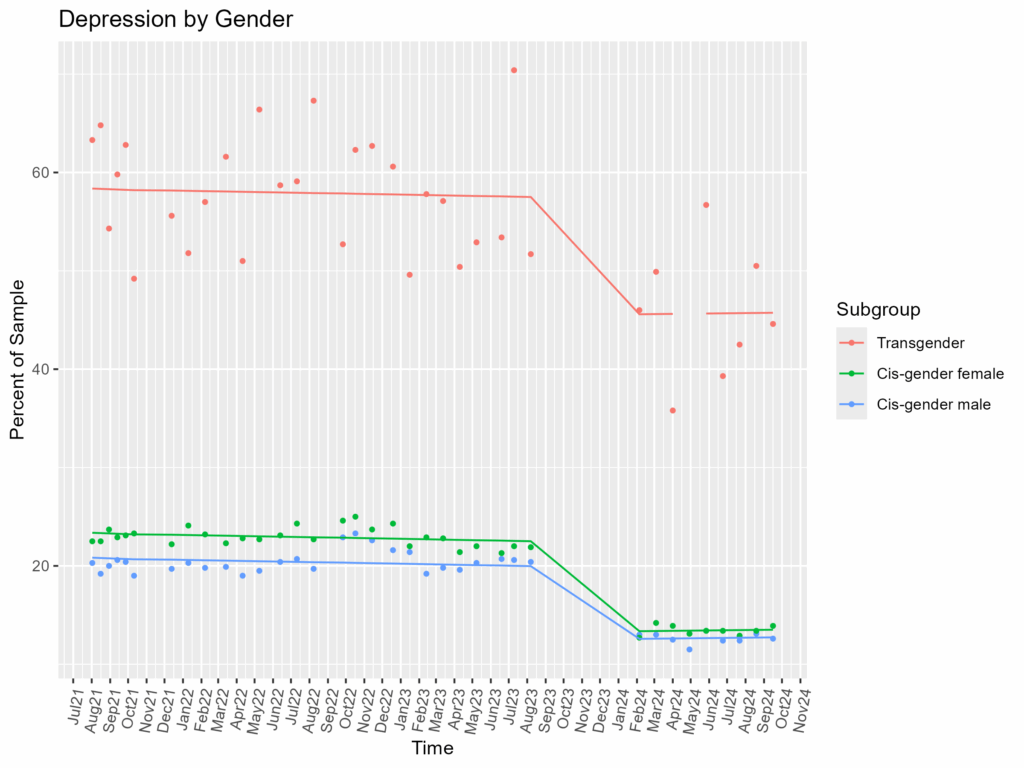
- Nearly Half of Transgender Individuals are Depressed
- Transgender individuals have a very high rate of depression, a massive 35 percentage points more depressed than women and 37 points more than men from 2021-2023. This difference improves only slightly but remains stark in 2024 (“only” 32 and 33 points difference respectively).
- High Variability in Transgender Depression Rates
- Take a look at how high and low the raw data of transgender individuals swings around the trend line? This is consistent with data collection of a small, hard to reach population.
Anxiety
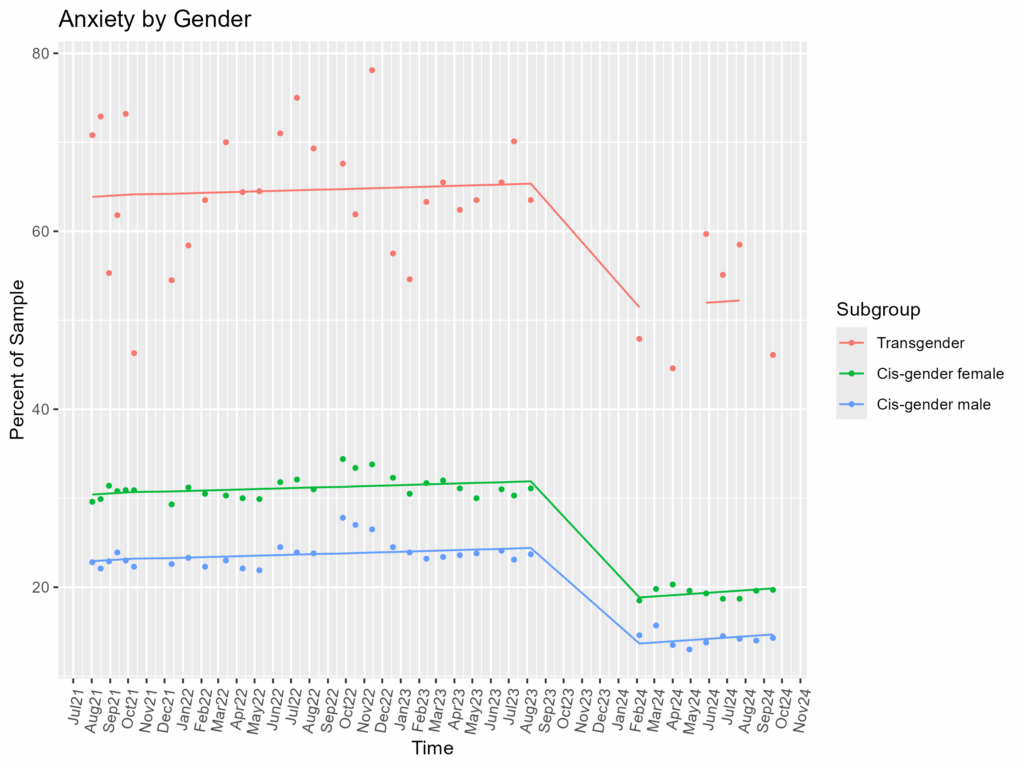
- Transgender Individuals = Very High Anxiety
- Like depression, transgender individuals have a high rate of anxiety, 33 percentage points more depressed than women and a huge 41 points more than men from 2021-2023. This difference improves slightly but remains stark in 2024 (“only” 33 and 38 points difference respectively).
- More High Variability
- As before, lots of fluctuating around for transgender respondents, e.g. from 2021-2023 going as “low” as 50% to highs of nearly 80%.
Sexuality
The CDC offered a simple range of sexual orientations to choose from. Accordingly, these data won’t include other potential category labels (e.g., queer, asexual, etc.). See here if you’re interested in more diverse considerations of sexual orientation labels.
Depression
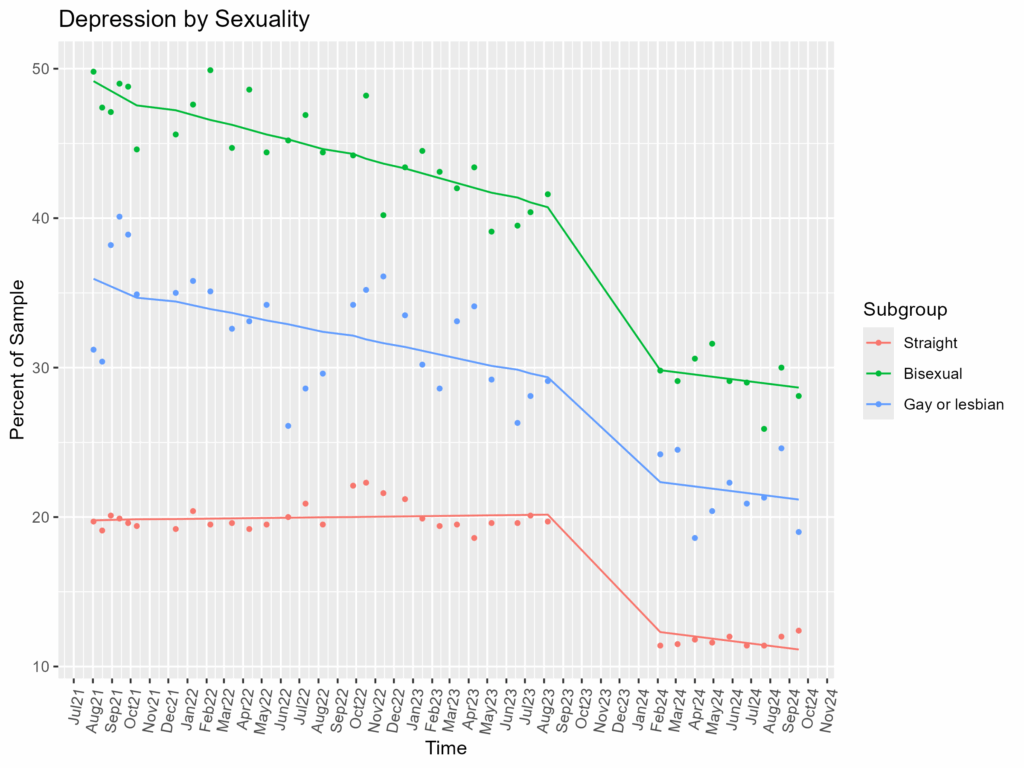
- Bisexual Individuals are Most Depressed (~30% in 2024)
- Bisexual respondents were nearly 40 percentage points higher than straight respondents from the start (see Technical Details for more) then down to “only” 17 points higher from 2024. However, their depression rates declined faster than anyone else over the 2021-2023 period.
- Heteronormative Privilege
- Both non-heteronormative groups (bisexual, gay or lesbian) here were much higher than straight individuals. While they too decreased over time, gay or lesbian respondents were about 25 percentage points higher than the straight respondents from 2021-2023 and 10 points higher from 2024.
Anxiety
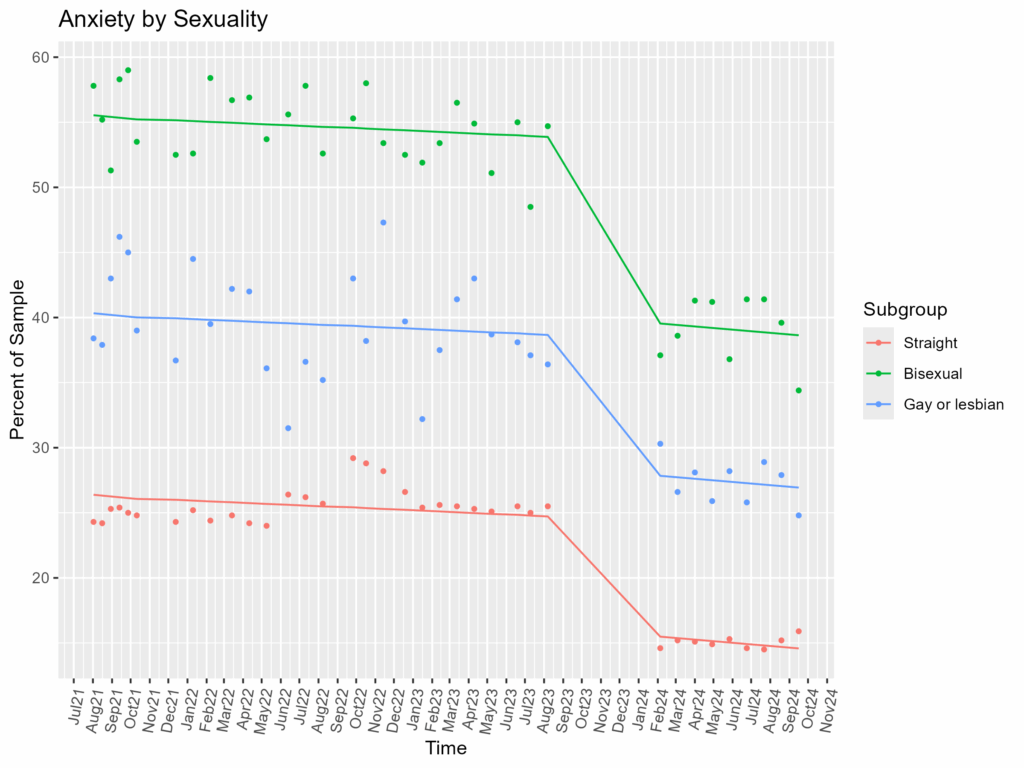
- Bisexual Individuals are Most Anxious (~40% in 2024)
- Bisexual respondents were much more anxious than anyone else, over half of them were anxious from 2021-2023, about 30 percentage points higher on average than straight respondents and nearly 15 higher than gay or lesbian respondents. Even in 2024, they were still 24 points higher than straight and 12 above gay or lesbian respondents.
- Again, Heteronormative Privilege
- Straight respondents had notably less anxiety than any non-heterosexual group. Gay or lesbian respondents were still 12-14 percentage points higher than straight respondents across the entire period.
Race/Ethnicity
Depression
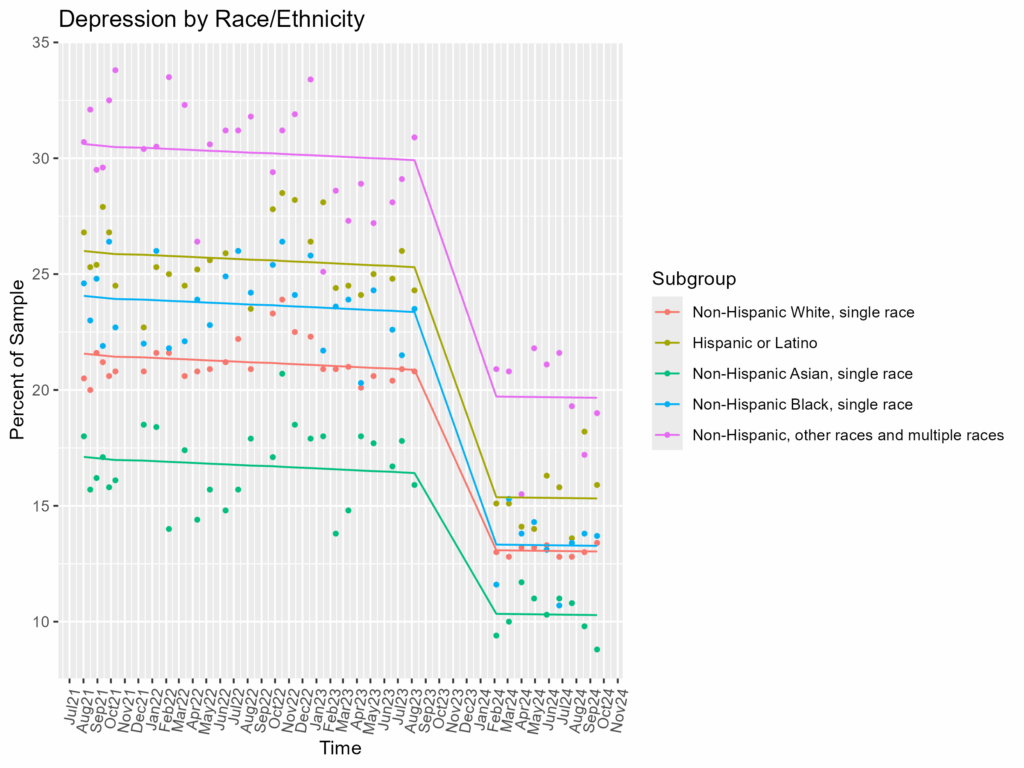
- Penalty Outside the Boxes, “Other & Multiple Races” (~20% in 2024)
- The percentage of “other” or multiple races respondents who were depressed was about 9 points higher than white respondents from 2021-2023, and about 7 points higher in 2024.
- Otherwise, Mostly Overlapping Depression
- Other than “Other & Multiple Races”, all other racial and ethnic categories were within 5 percentage points of the white reference group throughout the entire period.
Anxiety
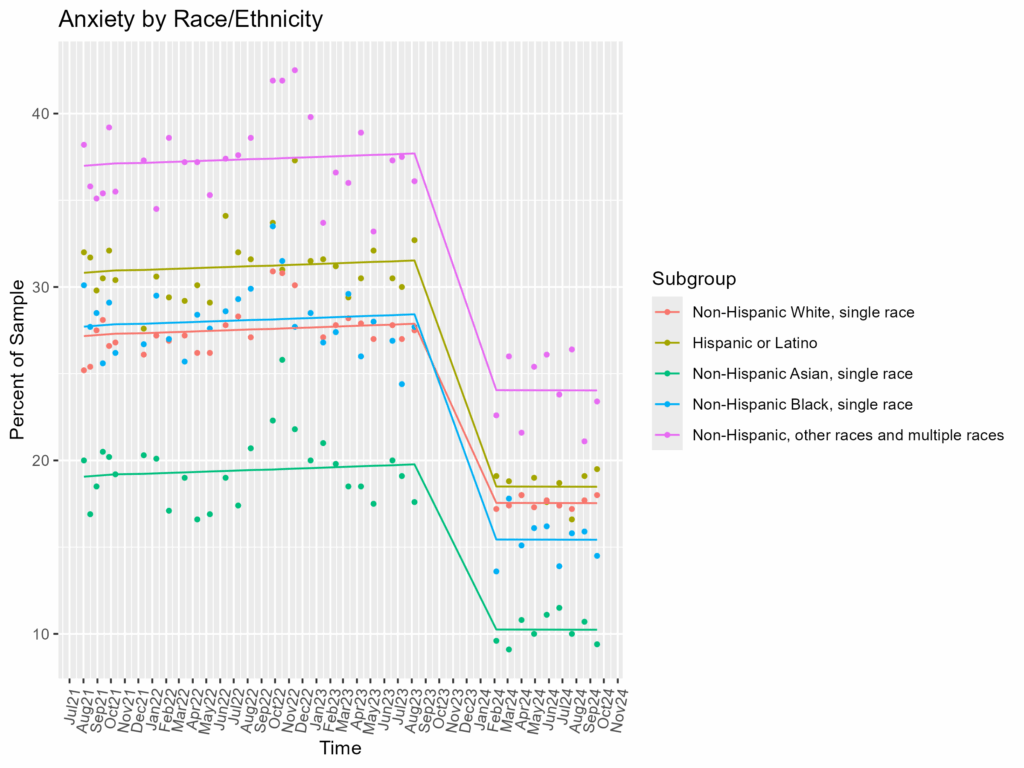
- Again, Penalty for “Other” (~24% in 2024)
- Like depression, the percentage of “other” or multiple races respondents who were anxious was quite high, about 10 percentage points higher than white respondents from 2021-2023 and 7 points higher in 2024.
- Asians Skew Low on Anxiety
- Asians consistently had the lowest rate of anxiety, about 8 percentage points lower than white respondents from 2021-2023 and 7 points lower in 2024.
Summary
From this long term data collected across the pandemic years, we can see a couple of things:
- Consistent Trends Over Time
- Very few trend lines crossed over each other. While some may have gone up and down, trend lines rarely if ever crossed another trend line. This was true even after the strange data gap from 2023 to 2024. In other words, the broad trends we saw here seem to be relatively stable
- E.g., 18-29 year olds were always more depressed than everyone else
- E.g., Female respondents were always more anxious than male respondents
- Very few trend lines crossed over each other. While some may have gone up and down, trend lines rarely if ever crossed another trend line. This was true even after the strange data gap from 2023 to 2024. In other words, the broad trends we saw here seem to be relatively stable
- Depression and Anxiety Parallel Each Other
- Anxiety tends to be slightly more prevalent, but by and large depression and anxiety share remarkably similar patterns throughout these data
- On Average…
- Most Depressed or Anxious?
- Young, LGBT (especially B & T) individuals, people outside classic standardized racial/ethnic categories (“other”/two or more)
- Least Depressed or Anxious?
- Elderly, male, heterosexual, Asians
- Most Depressed or Anxious?
Limitations, Caveats, & Considerations
Any good science has it’s fair share!
- Defining Depression and Anxiety is Complicated
- Theoretically speaking
- Depression has a long history of getting defined, then redefined, then again and again. Similarly, defining “problematic” anxiety (i.e., anxiety disorders) has also proved tricky with significant research and deliberation over the years. While the DSM-5 has current guidance on both depressive and anxiety disorders, these are American clinical psychology’s current best overall guidance. The DSM-5 was published in 2013, and the updated DSM-6 is expected to be published before 2030.
- Practically speaking
- This CDC study only used 2-items to measure each. While both measures are legitimate, fewer items generally means less precision and fewer opportunities to accurately capture the construct you’re interested in.
- Theoretically speaking
- Data Gap: and Score Cliff–a Revisit
- A worry at the start was whether that data gap and score cliff would muddy up our findings. Turns out, the trends we found are fairly consistent, thus we can be a bit more confident about the broad relationships.
- Take this hypothetical–
- Imagine an alternative situation where we saw young folks as the most anxious group from 2021-2023, then suddenly the least anxious in 2024. That would be strange and hard to say wasn’t due to something in that data gap. Luckily, we never saw big swings, much less any swings, like that in these data.
- Take this hypothetical–
- However, that there’s a data gap there at all introduces uncertainty. It’s also hard to tell whether reductions in depression or anxiety are more related to an improving pandemic situation or to data collection changes.
- A worry at the start was whether that data gap and score cliff would muddy up our findings. Turns out, the trends we found are fairly consistent, thus we can be a bit more confident about the broad relationships.
- Different Samples: Pro and Con
- Each month the CDC did this survey, they sampled new folks. On the one hand, this means have access to more people in the overall survey, which in theory means it’s more reflective of a general population. On the other hand, that means the trends in these data are more susceptible to sampling variability–if it was the same people getting surveyed each time, we can be sure a trend upward in depression is because, let’s say, March was indeed a more depressing month than February rather than possibly because we just found a new, slightly more depressed group of people for our March batch of surveys. Large sampling mitigates this risk, but we could see limitations of that in smaller population groups like with Transgender respondents.
- A Lot or Not?
- Is that difference a lot or not: up for debate! If I tell you that Asians are about 7 percentage points less anxious than white people, you may say “well, that’s not a big difference.” Ultimately, no amount of statistics can truly convince you that a number is meaningful–how big or small these effect sizes are are up to you and your use-case.
- Fair reminder though, with large populations like this, percentages can add up fast. Even 5% of the US population is still 17 million people, which is bigger than every single US state other than California, Texas, Florida, and New York.
- For example, “Back of the Envelope” Math
- US population: ~340,000,000 (2025)
- Male/Female Split: ~50/50, = ~170,000,000
- Female Anxiety Rate: ~20%, = ~34 million females (would be the 2nd largest US state by population)
- For example, “Back of the Envelope” Math
- Fair reminder though, with large populations like this, percentages can add up fast. Even 5% of the US population is still 17 million people, which is bigger than every single US state other than California, Texas, Florida, and New York.
- Is that difference a lot or not: up for debate! If I tell you that Asians are about 7 percentage points less anxious than white people, you may say “well, that’s not a big difference.” Ultimately, no amount of statistics can truly convince you that a number is meaningful–how big or small these effect sizes are are up to you and your use-case.
- US Centric Data
- Obvious but easily taken for granted. These data are collected in the US from a US federal institution. Federal groups have lots of reach, but may systematically miss some individuals (e.g. those who distrust or wish to limit government contact). Furthermore, we cannot claim these data reflect other nations or communities without some significant justification.
- Sex/Gender/Sexuality Social Limitations
- As alluded to in their respective sections, these data are highly standardized demographic categories. As such, they don’t reflect a particularly deep view of these social groups. While still a work in progress, social research still tends to be more fluid than these federally standardized categories in order to reflect and respect a wider human experience.
- Race/Ethnicity Social Limitations
- A good example to think about: “Asians, single race” is a huge conglomeration that could plausibly include anyone from Pakistan to India to Russia to Malaysia to China to Japan. Asia is nearly 5 billion people, almost 60% of the world’s population. And yet, we have a single category that implicitly claims they are all inherently similar. Beyond the fluidity and social history packed into racial and ethnic categories, bundling so many people together naturally limits some visibility and precision.
Resources If You Or a Someone You Know Need Help
- National Suicide Prevention Lifeline (U.S.): Call or text 988 for confidential support 24/7. Visit 988lifeline.org for more information.
- Anxiety and Depression Association of America (ADAA): Offers resources, support groups, and educational materials. Learn more here.
- Crisis Text Line: Text HOME to 741741 (U.S. and Canada) to connect with a trained crisis counselor. Visit crisistextline.org for information and options.
- Mental Health America (MHA): Provides mental health screenings and resources. Explore their tools here.