As any local would tell you, Seattle is not exactly a commuter’s-paradise. While that’s been changing over the past decade with light rail extensions and reworked bus and bike lanes, this city of hills and water corridors can make for a tricky time getting around. We love those hills and blue, but dang do they get in the way sometimes.
I wanted to get a better idea of what getting around Seattle looks like–literally. So I’ve made some maps in ArcGIS using public GIS data from Seattle’s GeoData. Here are a few projects I’ve made that may shed some light about what it means to get around the Emerald City.
Commuting: Who ‘Actually‘ Has the Worst Commute?
Here is a map showing the most commonly reported commute time per neighborhood bloc.
For my purposes, I’m just talking about those within Seattle City limits. Though as someone growing up on the Eastside, rest assured I see all of you commuting from afar (Everett, Bainbridge, and all the rest).
Hilly Differences
We can tell from here that the central downtown zone favors the shortest commutes. However, we also see a split between corresponding central, hilly neighborhoods–Capital Hill is ostensibly just as close, if not closer, to central Seattle as Queen Anne and Interbay. However, the latter enjoy much shorter commutes. This suggests the neighborhoods cater to employees of different companies–Queen Anne likely commutes more to downtown and South Lake Union, while Capital Hill denizens will be more likely to commute further afield.
Squeezing Through Suburbia
To no surprise, those on outer reaches of the city–firmly in suburbia–tend to have longer commutes. But what is notable is by how much. Take West Seattle: the most commonly reported commute time was 20-24 minutes in central West Seattle–move just a tad further to the westerly Sound-facing neighborhoods and that commute time doubles. This highlights the idea that commute time is not just a distance issue, it’s a “stuff between me and work” issue; how many more stoplights, small streets, arterials, highways etc. do you need to get through?
We also see a relative equidistant effect from downtown, spiraling outward like a target–the further from downtown, the longer your commute. This is not to say that everyone is heading downtown for work, in fact there are notable vacancies in the central business district as of 2026. But it does say something that, generally speaking, the northernmost and southernmost sides of the city have fairly equally rough commutes–one side is not notably worse off than the other.
The Search for the Most Dangerous Intersection in Seattle
There’s more than one way to talk about high collision areas in Seattle. First one is perhaps the most obvious–what intersections have the most collisions? But perhaps you have a bunch (but not a ton) of collisions on one block, and the next block…and the next block? Individually, nothing special but clustered together makes for a rough place to be. That’s where these two maps come in.
Count em’ Up
SDOT has public collision data going back to 2004. I added up all the collisions grouped by location and filtered down to the top 10 worse locations. Here are the exact locations and number of incidents below:
| Location | # of Collision Incidents |
| Aurora Ave N between N 130th St and N 135th St | 338 |
| Aurora Ave N between N 117th Pl and N 125th St | 326 |
| N Northgate Way between Meridian Ave N and Corliss Ave N | 323 |
| Rainier Ave S between S Bayview St and S Mcclellan St | 319 |
6th Ave and James St | 310 |
| Aurora Bridge between Raye St and Bridge Way N | 252 |
| West Seattle Bridge East-bound between Alaskan Way Viaduct North-bound On-ramp and Delridge-West Seattle Bridge East-bound On-ramp | 248 |
| Rainier Ave S Between S Charlestown St and S Andover St | 203 |
| 5th Ave and Spring St | 188 |
| Rainier Ave S between S Dearborn St and S Charles N St | 188 |
Some notable patterns here!
- North Aurora: There is a stretch of blocks spanning the north and south sides of N 130th St on Aurora that take up both the 1st and 2nd spots. This is far and away the highest single collision ~1-mile stretch in Seattle.
- Bridges: We also see major (but not interstate) bridges stand out–the Aurora Bridge and West Seattle Bridge both make an appearance on this list.
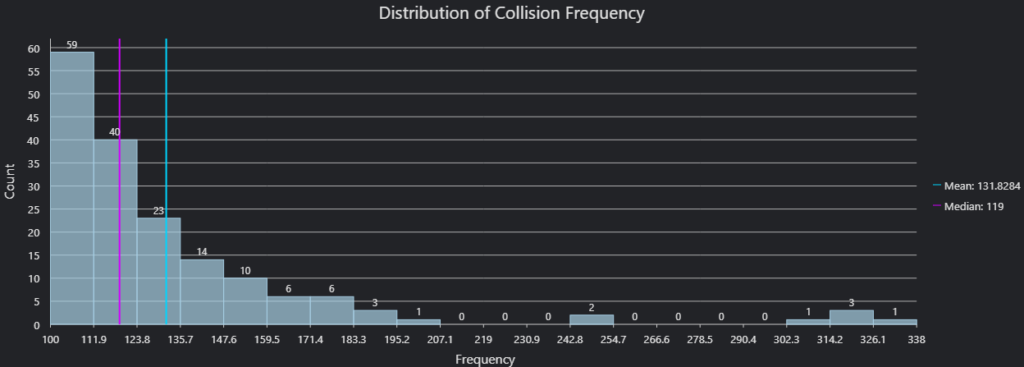
- Tiers of Incidents: Even in just the Top 10 worst collision zones, we see some “tiers” stand out. Here’s what I mean: the top 5 all have 300+ collisions, then a big drop down to mid-250s…then another big drop drops to around 200. This makes the worst ranked place is nearly double that of the 10th. If you look at every collision, the trend gets even clearer:
- This histogram shows the distribution of collisions–the top 10, even just the top 7, are WAY higher than everyone else.
Density: Concentration of Collisions
As a density heatmap we can see that, cumulatively, downtown is the hotspot for collision events. While individually each block may not stand out (relative to, say, the Aurora Bridge) the density map shows how cumulatively frequent collisions are in the downtown corridor.
All of downtown is a hotspot, but we also see a light pattern here–we see spikes in collision around on-ramps. From our collision counting table earlier, 6th Avenue and James Street and 5th and Spring Street intersections stand out amidst the noise of downtown. One potential reason why? They are intersections featuring high-volume turning from one busy road into another to make it onto an I-5 South on-ramp. We can also see that 1st avenue and 5th avenue, at least by proxy of collisions, are the most trafficked corridors in downtown.
We also see Capital Hill stand out, notably absent from our earlier Top 10 most collision counts from before. Particularly, cross-intersections along Broadway that give access to downtown: the Pike/Pine Corridor (right around Cal Anderson Park and Seattle Central College), Broadway and E John Street (by the Capital Hill Light Rail Station), and the 5-way Madison and 12th Avenue intersection (by Seattle University and Seattle Academy). We would not have caught this zone had we stuck with only our earlier collision counts.